The partner program engine
We source qualified vendor partners, run the outbound, and book partner conversations directly onto your calendar.
A five-step partner pipeline your team doesn’t have to staff.
We map the vendor categories most aligned with your members, including supply, equipment, technology, financial services, insurance, beverage, and delivery, then build a qualified target list.
We write and send measured, non-spammy email outreach signed by your team. Cadences are calibrated to the category.
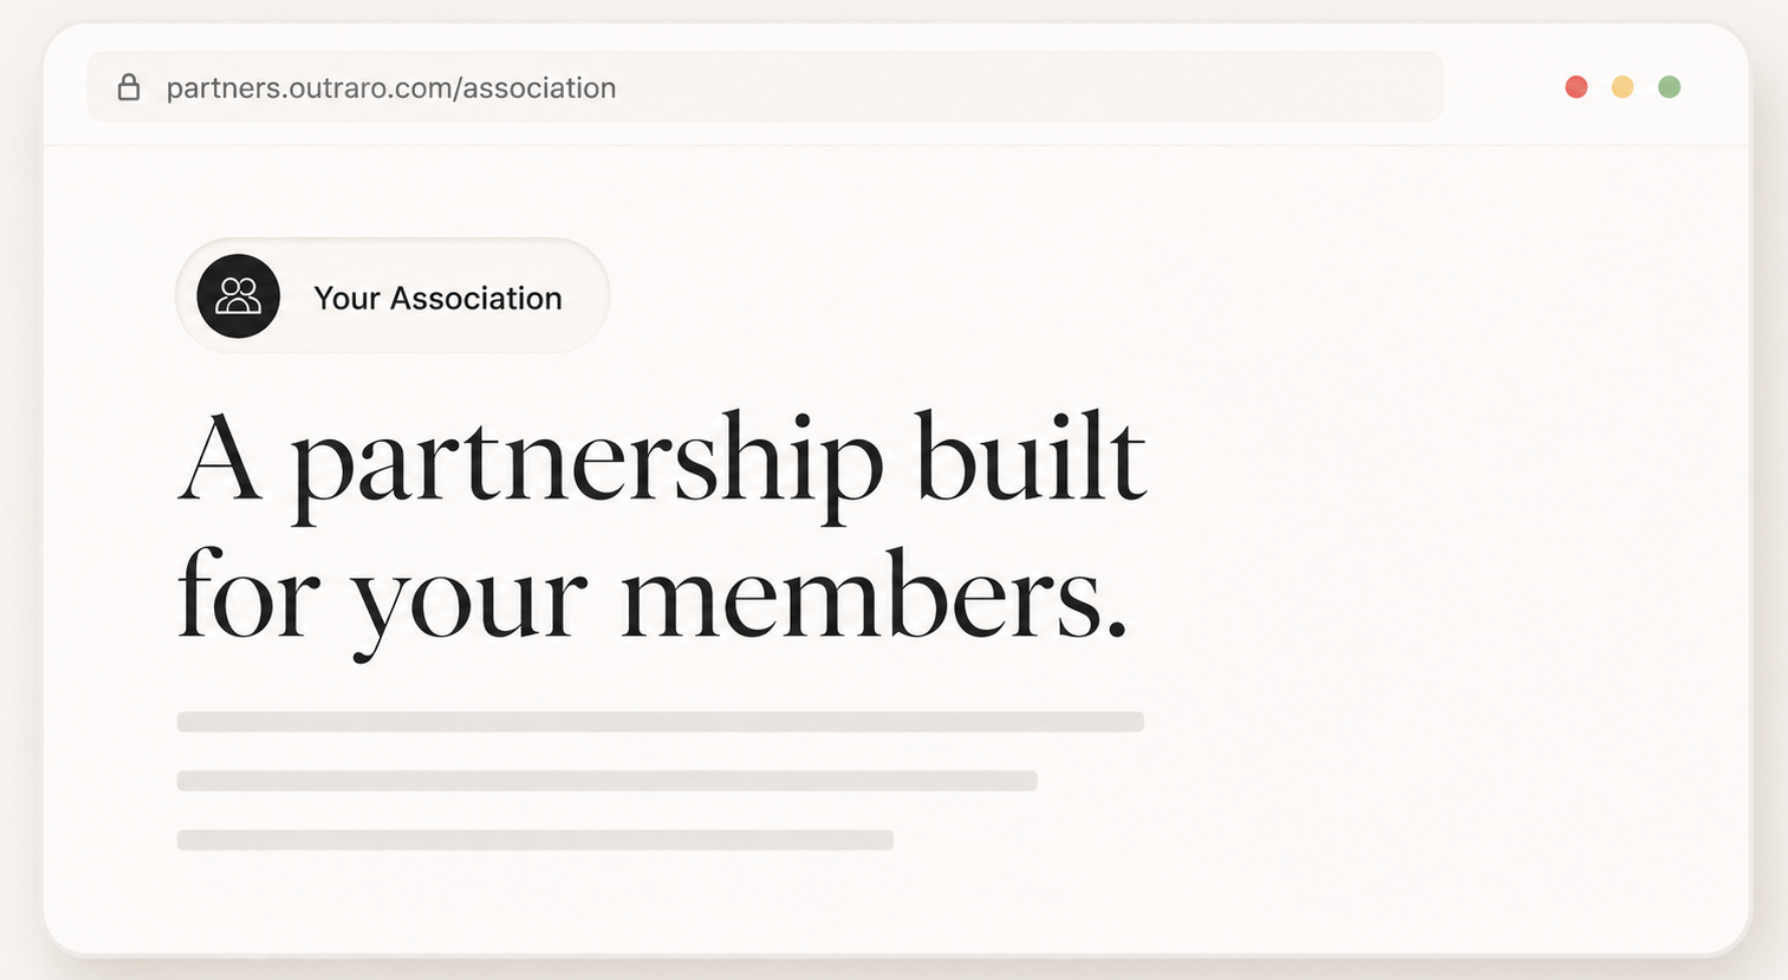
Each campaign uses a personalized landing page at partners.outraro.com/<your-org>, built to make partners feel they’re engaging with your association directly.
No back-and-forth, no scheduling hand-offs. Calendars connect directly to your team. Every booked meeting is a real, qualified partner conversation.
Every meeting booked, held, and converted is tracked in a shared dashboard. We meet monthly to review pipeline, refine targeting, and adjust the motion.
Our partner pipeline generated $5M in deal value.
At DiRoNA, we ran the same partner program from sourcing to booking in the calendar. The result was a measured, repeatable pipeline of partner conversations with the right vendors, and a category playbook we now run for restaurant associations.
“Outraro changed everything for us. Instead of chasing one-off vendors, we built a predictable partner pipeline.” Partnership lead, DiRoNA
Aligned with the only thing that matters: qualified partner conversations.
Quarterly base, performance on top.
Engagements start at $9,000 for a 3‑month pilot, plus a performance fee per qualified meeting held.
- Quarterly base for setup and program operations
- Performance fee per qualified meeting held
The 90-day guarantee.
At least 20 qualified partner conversations in your first 90 days, or we work for free until we hit it.
- Qualified means: right vendor category, decision-maker, real interest, meeting held
- Tracked transparently in a shared dashboard
- Reviewed monthly with your Head of Partnerships
Let’s see if there’s a fit.
Book a call to walk through your program, your vendor categories, and what we’d focus on in the first 90 days.
Direct answers to fair questions.
Most associations have three or four anchor sponsors that account for the majority of partner revenue. We build the mid-tier underneath them, the 15 to 40 partners who together can match or exceed your top one. That base is what makes partner revenue durable instead of concentrated.
Neither do we. Every campaign is approved by your team before it runs. Volume is calibrated, not maximized. Copy is written by people who understand the category. The bar is: would your members be comfortable seeing this in their own inbox.
Small programs benefit the most. The motion gives a small team the leverage of a full partnerships function without hiring four people. If you have a Head of Partnerships and a willingness to take partner calls, you have enough to start.
A qualified partner conversation is one where the vendor is in a relevant category, is represented by a decision-maker or budget owner, has real interest in a partnership with your association, and where the meeting is actually held. Booked-but-no-show meetings don’t count toward the guarantee.
Every meeting booked, held, advanced, and closed is logged in a shared dashboard. You always have direct access to it. We meet monthly with your Head of Partnerships to review pipeline, refine targeting, and adjust the plan.
You do, completely. We sit behind your team. Outreach is signed by your people. Calls happen on your calendar. Contracts are with you. We are the engine, not the face.
Because depth beats breadth. The vendor categories, the buying patterns, the seasonal cadence, and the language of restaurant operators are specific. We’ve made the choice to be excellent in one category rather than mediocre in many.